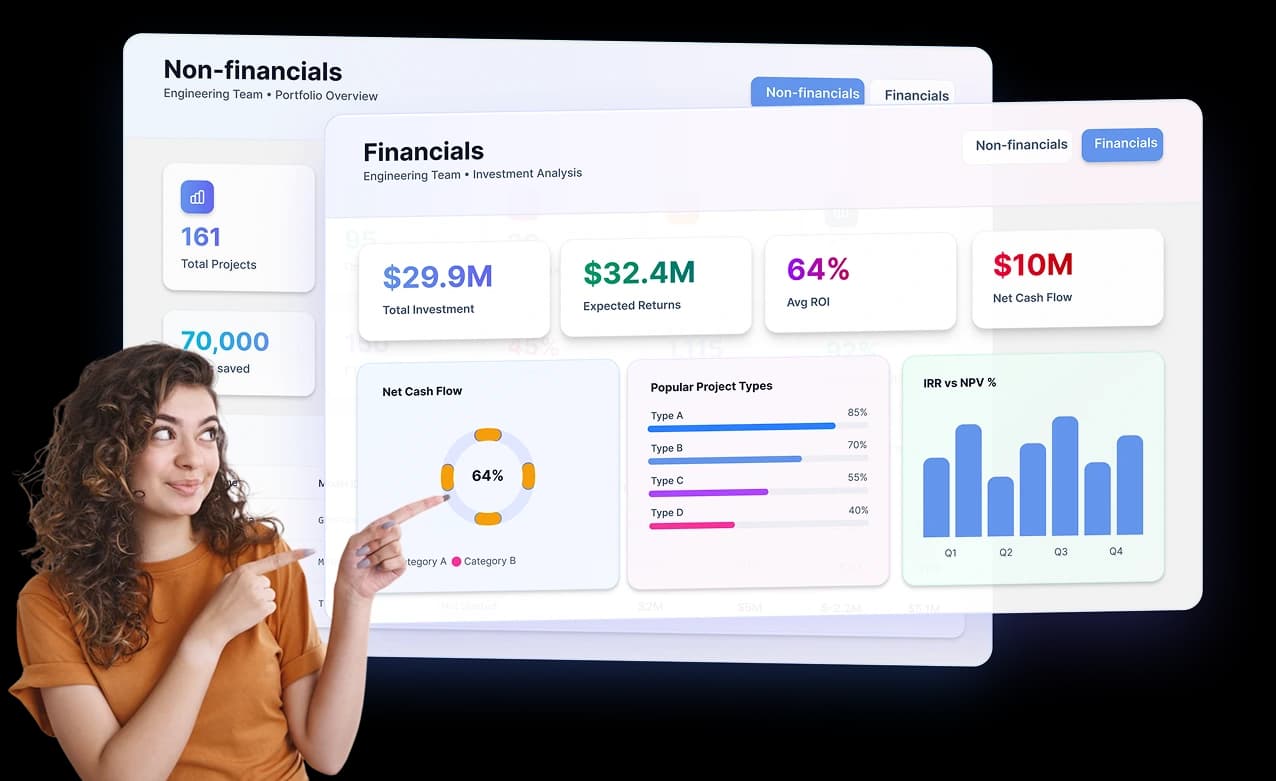
Your instincts got the portfolio this far. Now govern it with data.

Portfolio aggregates every project model and value tracker into a single, decision-ready view so executives can compare investments, run what-if scenarios, optimize for real constraints, and act on the intelligence the data is already telling them.

Hero demo image
icon

View every project. Every metric.

ROI, NPV, IRR, payback, and cash flow across every initiative — aggregated, compared, and decision-ready in a single consolidated dashboard.

icon

Real-time live against actuals

Portfolio KPIs update automatically as Value Tracker records actuals. No manual refresh. No stale data in the board pack.

icon

“What-if” before you commit capital

Run scenario analysis across the entire portfolio before any funding decision is made or any resource is committed.

decorative imagedecorative image
Feature Capabilities
PORTFOLIO DASHBOARD

Stop managing your portfolio one project at a time.

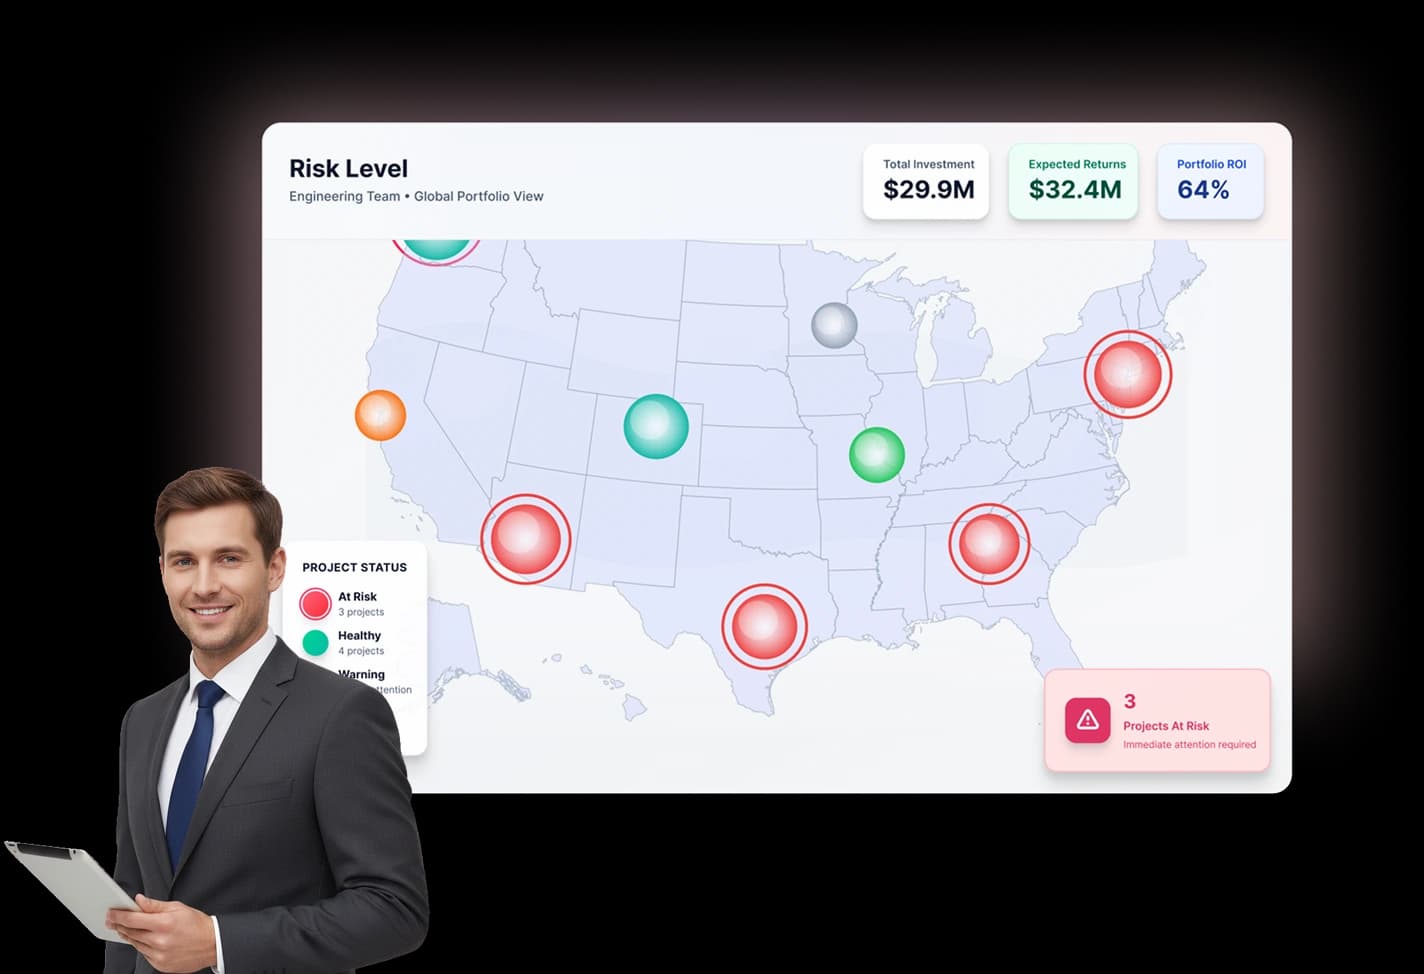
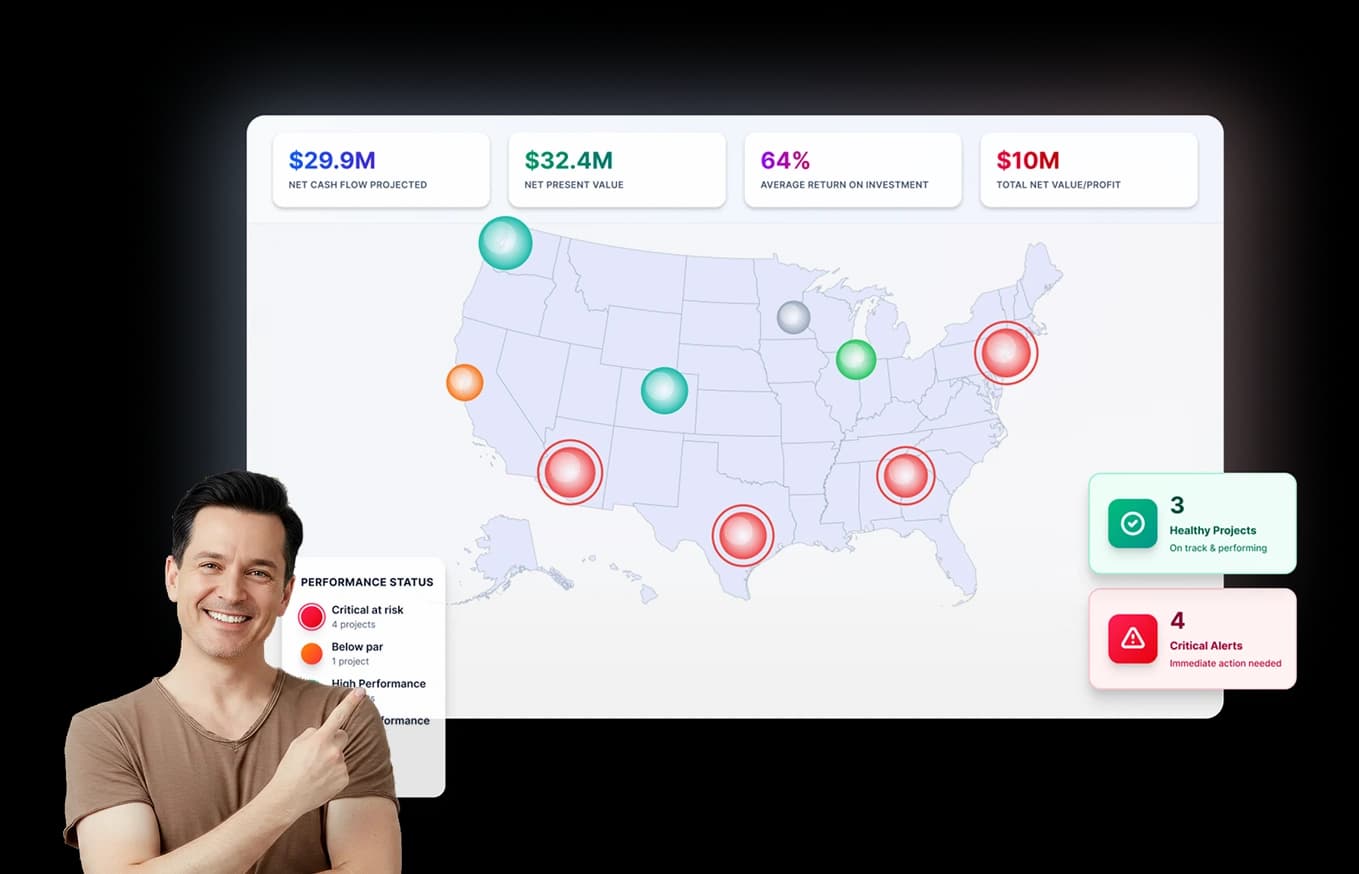
This is the view CFOs want in their inbox Monday morning and the one boards want projected in the room. Every project model and business case rolls up into a single consolidated dashboard, showing portfolio-level ROI, NPV, IRR, payback, and cash flow curves across years. See the health of every initiative without opening individual projects.

project portfolio management dashboard
RISK & EXPOSURE

Know where concentration risk is building before it becomes a board conversation.

Filter your portfolio by region, sector, or strategic category to see where capital is clustered and where risk is concentrated. Identify projects with elevated risk profiles before they drag down the portfolio's overall performance. Surface which initiatives are exceeding risk thresholds and need intervention before the quarterly review puts you on the defensive.

project portfolio management risk and exposure dashboard
MAP VIEW

See where your capital lives and whether it's performing where it's deployed.

Visualize your portfolio geographically. See where capital is concentrated, which regions are generating the strongest returns, and where underperformance is clustering. Click any region to surface the top variance drivers immediately without leaving the map or opening a separate report.

image
Testimonials

What Our Clients Are Saying About Us

For the first time, I walked into a board meeting with live portfolio data instead of a slide deck built three weeks earlier. The conversation shifted from 'is this right?' to 'what do we do about it?' That's a different kind of meeting.

James Burtler

James Burtler

CEO, Global Infrastructure Business

The scenario analysis changed how we allocate capital mid-year. We ran four scenarios in an afternoon that would have taken two weeks in spreadsheets. We made a $4M reallocation decision the same day.

Michael Johnson

Michael Johnson

VP of Finance, Enterprise Technology Company

FAQ section
FAQs

Frequently asked questions.

Still have questions?

Can’t find the answer you are looking for? Kindly check our complete list of FAQs.

decorative image

Your portfolio deserves more than a quarterly review and a

hope for the best.

Connect your projects and get a live, consolidated view in minutes. No migration project. No IT dependency. Just portfolio intelligence from the models your team has already built.

SOC 2 Type IINo credit card requiredConnects to Model Builder